

| 일 | 월 | 화 | 수 | 목 | 금 | 토 |
|---|---|---|---|---|---|---|
| 1 | 2 | 3 | 4 | 5 | ||
| 6 | 7 | 8 | 9 | 10 | 11 | 12 |
| 13 | 14 | 15 | 16 | 17 | 18 | 19 |
| 20 | 21 | 22 | 23 | 24 | 25 | 26 |
| 27 | 28 | 29 | 30 |
- Coordinate Systems
- Routh-Hurwitz
- Bilinear Transform
- Euler Angle Rates
- Unity Feedback System
- Pure Integrater
- 1st-order
- 2nd LPF
- ROC
- Rise Time
- Parseval's Theorem
- 0.707
- FVT
- System Type
- Steady-State Error
- Evans' Method
- 부분 분수분해
- System Sensitivity
- 푸리에 급수
- Body Angular Velocity
- Overshoot
- Rotation Matrix
- %OS
- Laplace Transform
- 2nd-order system
- natural frequency
- damping ratio
- FSC
- Disturbance
- Equivalent Systems
OnlyOne
2nd-Order Systems: Derivations of %OS and Rise Time, and Simulation-Based Dynamic Validation 본문
2nd-Order Systems: Derivations of %OS and Rise Time, and Simulation-Based Dynamic Validation
Taesan Levin Kim 2026. 8. 23. 04:212nd-Order Systems: Derivations of %OS and Rise Time, and Simulation-Based Dynamic Validation
In classical control engineering, 2nd-order systems form the foundation for evaluating dynamic performance metrics such as overshoot, response speed, and stability margins. In this post, we mathematically derive the exact closed-form expressions for Percentage Overshoot (%OS) and Rise Time (t_r) in terms of the damping ratio (zeta) and natural frequency. Furthermore, we write simulation scripts to observe how changing zeta or omega_n impacts Peak Time (t_p), %OS, Settling Time (t_s), and Rise Time (t_r).
Mathematical Derivation of Percentage Overshoot
Consider the standard prototype 2nd-order underdamped system (0 < zeta < 1) with transfer function G(s):
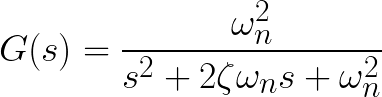
For a unit step input
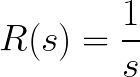
, the output in the time domain c(t) is given by:

To find the peak time where the maximum output occurs, we set the time derivative 0:

The first non-zero peak occurs when
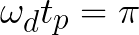
, yielding the Peak Time (t_p):
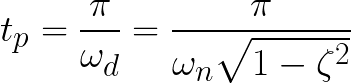
Substituting t_p back into c(t) to find the peak value c(t_p):
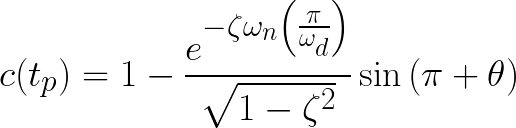
Using the trigonometric identity

:

Percentage Overshoot (%OS) is defined relative to the steady-state value c(∞) = 1:

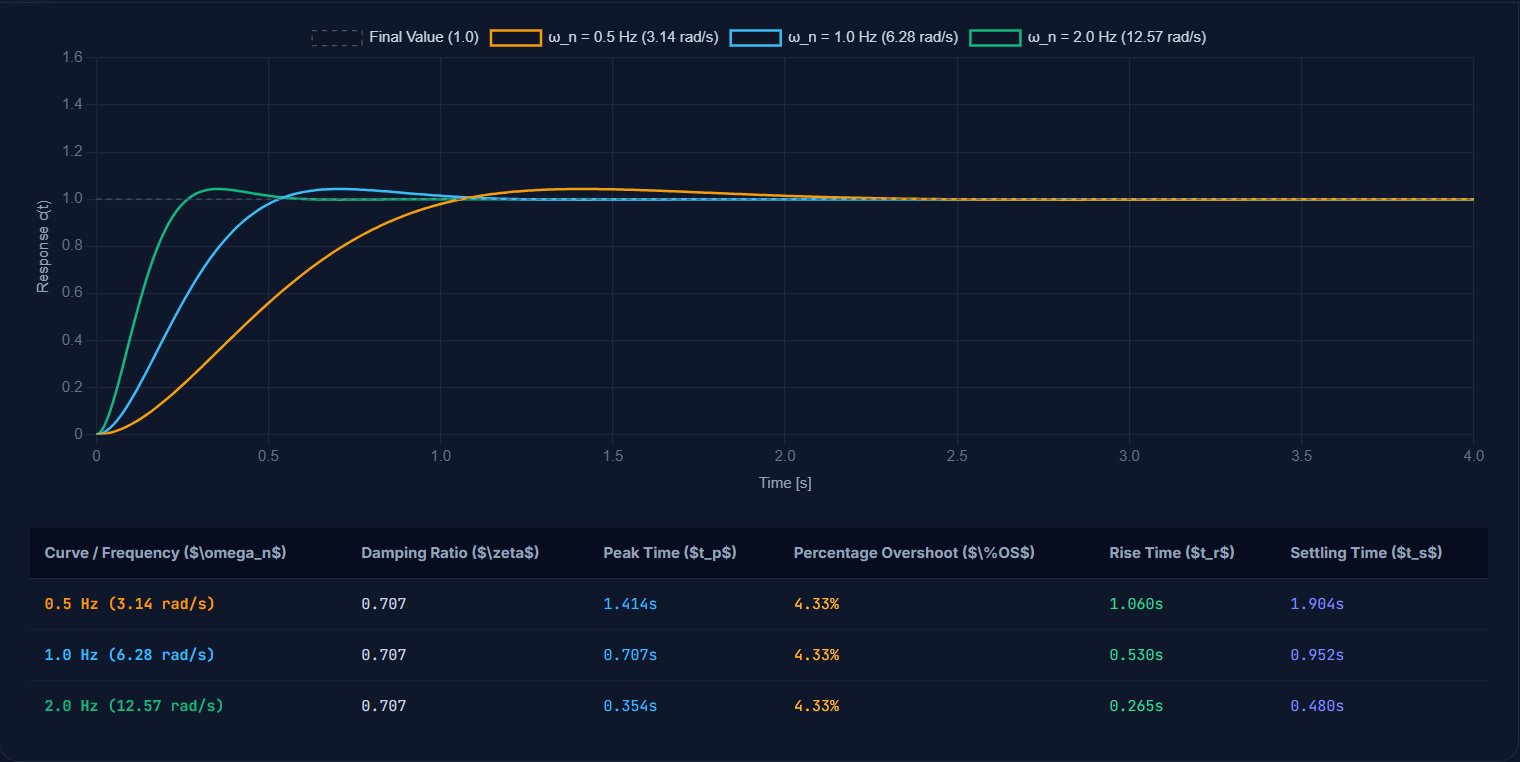
Percentage Overshoot (%OS) is solely a function of the damping ratio (zeta) and is completely independent of the natural frequency (omega_n).
Mathematical Derivation of Rise Time (t_r)
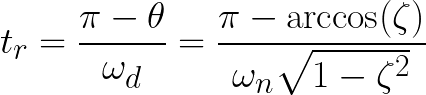
For an underdamped 2nd-order system, Rise Time (t_r) is defined as the time required for the response to rise from 0% to 100% of its final value (c(t_r) = 1):


The smallest positive solution occurs when

:
Alternatively, expressing

(in radians):
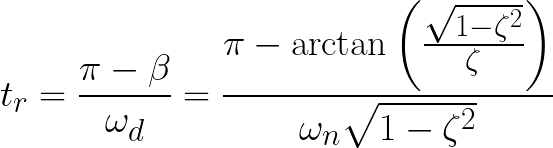
Rise Time is inversely proportional to natural frequency. Increasing omega_n speeds up the response (reduces t_r), while increasing zeta increases t_r (slows the initial rise).
Simulation Analysis: Validating Dynamic Performance
To observe the physical trade-offs, we execute two distinct simulations:
Simulation 1: Fixed Damping Ratio (zeta = 0.707), Varying Natural Frequency (omega_n)
Simulation 2: Fixed Natural Frequency (omega_n = 2pi * 1.0 [rad/s]), Varying Damping Ratio (zeta)
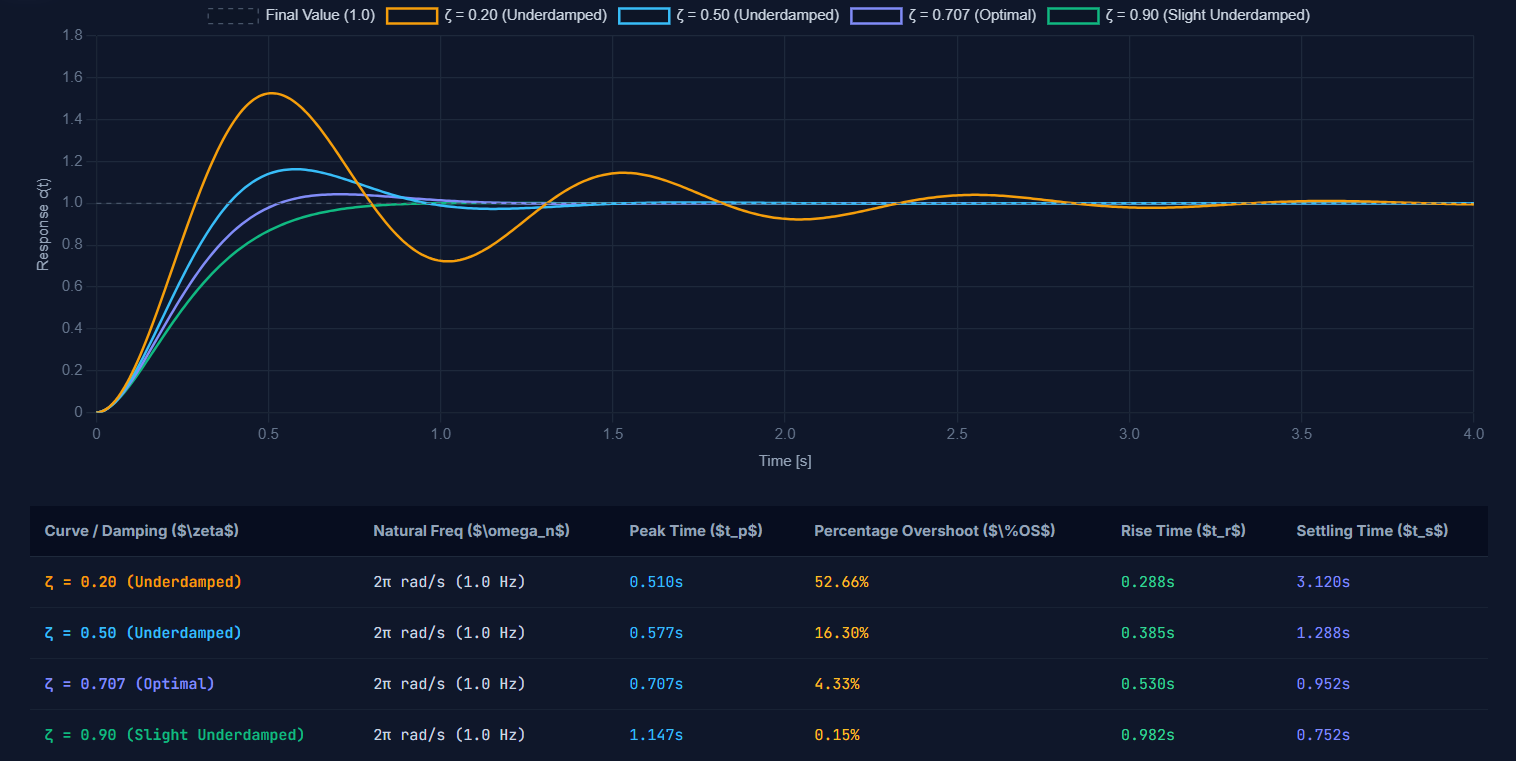
<!DOCTYPE html>
<html lang="en">
<head>
<meta charset="UTF-8">
<meta name="viewport" content="width=device-width, initial-scale=1.0">
<title>2nd Order System Step Response Visualizer</title>
<!-- Tailwind CSS CDN -->
<script src="https://cdn.tailwindcss.com"></script>
<!-- Chart.js CDN -->
<script src="https://cdn.jsdelivr.net/npm/chart.js"></script>
<!-- FontAwesome icons CDN -->
<link rel="stylesheet" href="https://cdnjs.cloudflare.com/ajax/libs/font-awesome/6.4.0/css/all.min.css">
<style>
@import url('https://fonts.googleapis.com/css2?family=Inter:wght@300;400;500;600;700&family=JetBrains+Mono:wght@400;600&display=swap');
body {
font-family: 'Inter', sans-serif;
background-color: #0f172a;
color: #f8fafc;
}
.code-font {
font-family: 'JetBrains Mono', monospace;
}
</style>
</head>
<body class="min-h-screen pb-12">
<!-- Top Navigation Header -->
<header class="border-b border-slate-800 bg-slate-900/80 backdrop-blur sticky top-0 z-50">
<div class="max-w-7xl mx-auto px-4 py-4 sm:px-6 lg:px-8 flex flex-col sm:flex-row justify-between items-center gap-4">
<div class="flex items-center space-x-3">
<div class="p-2.5 bg-indigo-600 rounded-xl shadow-lg shadow-indigo-500/30">
<i class="fa-solid fa-wave-square text-xl text-white"></i>
</div>
<div>
<h1 class="text-xl font-bold bg-clip-text text-transparent bg-gradient-to-r from-indigo-400 via-sky-300 to-emerald-400">
2nd Order System Step Response Simulator
</h1>
<p class="text-xs text-slate-400">Automatic Control Theory Visualization & Performance Metrics Analysis</p>
</div>
</div>
<!-- Tab Selection -->
<div class="flex bg-slate-800/80 p-1 rounded-xl border border-slate-700/60 text-xs sm:text-sm">
<button id="tab-interactive" onclick="switchTab('interactive')" class="px-4 py-1.5 rounded-lg font-medium transition-all duration-200 bg-indigo-600 text-white shadow-md">
<i class="fa-solid fa-sliders mr-1.5"></i>Interactive Explorer
</button>
<button id="tab-sim1" onclick="switchTab('sim1')" class="px-4 py-1.5 rounded-lg font-medium transition-all duration-200 text-slate-400 hover:text-white">
<i class="fa-solid fa-chart-line mr-1.5"></i>Sim 1 (Fixed $\zeta$)
</button>
<button id="tab-sim2" onclick="switchTab('sim2')" class="px-4 py-1.5 rounded-lg font-medium transition-all duration-200 text-slate-400 hover:text-white">
<i class="fa-solid fa-chart-line mr-1.5"></i>Sim 2 (Fixed $\omega_n$)
</button>
</div>
</div>
</header>
<!-- Main Container -->
<main class="max-w-7xl mx-auto px-4 sm:px-6 lg:px-8 mt-6">
<!-- TAB 1: INTERACTIVE EXPLORER -->
<div id="view-interactive" class="space-y-6">
<!-- Controls & Top Metrics Row -->
<div class="grid grid-cols-1 lg:grid-cols-12 gap-6">
<!-- Controls Panel (Left 4 cols) -->
<div class="lg:col-span-4 bg-slate-900 border border-slate-800 rounded-2xl p-5 shadow-xl space-y-5">
<div class="border-b border-slate-800 pb-3 flex justify-between items-center">
<h2 class="font-semibold text-slate-200 text-sm tracking-wide uppercase flex items-center">
<i class="fa-solid fa-gear text-indigo-400 mr-2"></i> System Parameters
</h2>
<button onclick="resetParams()" class="text-xs text-indigo-400 hover:text-indigo-300 transition-colors">
<i class="fa-solid fa-rotate-left mr-1"></i>Reset
</button>
</div>
<!-- Zeta Slider -->
<div class="space-y-2">
<div class="flex justify-between items-center text-sm">
<label for="slider-zeta" class="text-slate-300 font-medium">Damping Ratio ($\zeta$)</label>
<span id="val-zeta" class="code-font text-indigo-400 font-semibold px-2 py-0.5 bg-indigo-950/60 rounded border border-indigo-800/50">0.707</span>
</div>
<input type="range" id="slider-zeta" min="0.05" max="2.0" step="0.005" value="0.707"
class="w-full h-2 bg-slate-800 rounded-lg appearance-none cursor-pointer accent-indigo-500">
<div class="flex justify-between text-[10px] text-slate-500">
<span>Underdamped (0 < $\zeta$ < 1)</span>
<span>Critical ($\zeta=1$)</span>
<span>Overdamped ($\zeta > 1$)</span>
</div>
</div>
<!-- Omega_n Slider -->
<div class="space-y-2">
<div class="flex justify-between items-center text-sm">
<label for="slider-wn" class="text-slate-300 font-medium">Natural Frequency ($\omega_n$)</label>
<span id="val-wn" class="code-font text-sky-400 font-semibold px-2 py-0.5 bg-sky-950/60 rounded border border-sky-800/50">6.28 rad/s</span>
</div>
<input type="range" id="slider-wn" min="1.0" max="30.0" step="0.1" value="6.283"
class="w-full h-2 bg-slate-800 rounded-lg appearance-none cursor-pointer accent-sky-500">
<div class="flex justify-between text-[10px] text-slate-500">
<span>1.0 rad/s</span>
<span>15.0 rad/s</span>
<span>30.0 rad/s</span>
</div>
</div>
<!-- Presets -->
<div class="pt-2 border-t border-slate-800">
<span class="text-xs text-slate-400 mb-2 block font-medium">Quick Damping Presets:</span>
<div class="grid grid-cols-4 gap-2 text-xs">
<button onclick="setPreset(0.2, 6.283)" class="py-1.5 px-2 bg-slate-800 hover:bg-slate-700 text-amber-300 rounded-lg border border-slate-700/60 transition">
$\zeta=0.2$
</button>
<button onclick="setPreset(0.5, 6.283)" class="py-1.5 px-2 bg-slate-800 hover:bg-slate-700 text-sky-300 rounded-lg border border-slate-700/60 transition">
$\zeta=0.5$
</button>
<button onclick="setPreset(0.707, 6.283)" class="py-1.5 px-2 bg-indigo-900/50 hover:bg-indigo-800/50 text-indigo-200 rounded-lg border border-indigo-700/50 transition font-semibold">
$\zeta=0.707$
</button>
<button onclick="setPreset(1.2, 6.283)" class="py-1.5 px-2 bg-slate-800 hover:bg-slate-700 text-emerald-300 rounded-lg border border-slate-700/60 transition">
$\zeta=1.2$
</button>
</div>
</div>
<!-- s-Plane Pole Diagram Canvas -->
<div class="pt-2 border-t border-slate-800">
<div class="flex justify-between items-center mb-2">
<span class="text-xs text-slate-300 font-medium"><i class="fa-solid fa-crosshairs text-indigo-400 mr-1"></i> $s$-Plane Pole Locations</span>
<span id="pole-coords" class="code-font text-[11px] text-indigo-300">s = -4.44 ± j4.44</span>
</div>
<div class="relative bg-slate-950 rounded-xl p-2 border border-slate-800/80 flex justify-center">
<canvas id="sPlaneCanvas" width="300" height="180" class="w-full h-auto"></canvas>
</div>
</div>
</div>
<!-- Step Response Chart & Key Metrics Cards (Right 8 cols) -->
<div class="lg:col-span-8 space-y-6">
<!-- Key Performance Metrics Grid -->
<div class="grid grid-cols-2 sm:grid-cols-4 gap-4">
<!-- %OS Card -->
<div class="bg-slate-900 border border-slate-800 rounded-xl p-4 relative overflow-hidden shadow-lg">
<div class="absolute top-0 right-0 w-2 h-full bg-amber-500"></div>
<span class="text-xs text-slate-400 font-medium block">Percentage Overshoot</span>
<div class="flex items-baseline mt-1">
<span id="metric-os" class="text-2xl font-bold code-font text-amber-400">4.32</span>
<span class="text-xs text-amber-400 ml-1">%</span>
</div>
<span id="formula-os" class="text-[10px] text-slate-500 mt-1 block code-font">e^(-ζπ/√(1-ζ²))</span>
</div>
<!-- Peak Time Card -->
<div class="bg-slate-900 border border-slate-800 rounded-xl p-4 relative overflow-hidden shadow-lg">
<div class="absolute top-0 right-0 w-2 h-full bg-sky-500"></div>
<span class="text-xs text-slate-400 font-medium block">Peak Time ($t_p$)</span>
<div class="flex items-baseline mt-1">
<span id="metric-tp" class="text-2xl font-bold code-font text-sky-400">0.707</span>
<span class="text-xs text-sky-400 ml-1">sec</span>
</div>
<span class="text-[10px] text-slate-500 mt-1 block code-font">π / (ω_n √(1-ζ²))</span>
</div>
<!-- Rise Time Card -->
<div class="bg-slate-900 border border-slate-800 rounded-xl p-4 relative overflow-hidden shadow-lg">
<div class="absolute top-0 right-0 w-2 h-full bg-emerald-500"></div>
<span class="text-xs text-slate-400 font-medium block">Rise Time ($t_r$: 0→100%)</span>
<div class="flex items-baseline mt-1">
<span id="metric-tr" class="text-2xl font-bold code-font text-emerald-400">0.531</span>
<span class="text-xs text-emerald-400 ml-1">sec</span>
</div>
<span class="text-[10px] text-slate-500 mt-1 block code-font">(π - θ) / ω_d</span>
</div>
<!-- Settling Time Card -->
<div class="bg-slate-900 border border-slate-800 rounded-xl p-4 relative overflow-hidden shadow-lg">
<div class="absolute top-0 right-0 w-2 h-full bg-indigo-500"></div>
<span class="text-xs text-slate-400 font-medium block">Settling Time ($t_s$: 2%)</span>
<div class="flex items-baseline mt-1">
<span id="metric-ts" class="text-2xl font-bold code-font text-indigo-400">0.901</span>
<span class="text-xs text-indigo-400 ml-1">sec</span>
</div>
<span class="text-[10px] text-slate-500 mt-1 block code-font">≈ 4 / (ζ · ω_n)</span>
</div>
</div>
<!-- Main Plot Canvas Container -->
<div class="bg-slate-900 border border-slate-800 rounded-2xl p-5 shadow-xl">
<div class="flex justify-between items-center mb-4">
<h3 class="font-semibold text-slate-200 text-sm flex items-center">
<i class="fa-solid fa-chart-area text-indigo-400 mr-2"></i> Step Response Curve $c(t)$
</h3>
<div class="flex items-center space-x-4 text-xs text-slate-400">
<span class="flex items-center"><span class="w-3 h-0.5 bg-indigo-400 inline-block mr-1.5"></span> Response</span>
<span class="flex items-center"><span class="w-3 h-0.5 bg-slate-500 border-t border-dashed inline-block mr-1.5"></span> Final Value (1.0)</span>
<span class="flex items-center"><span class="w-3 h-0.5 bg-amber-400 inline-block mr-1.5"></span> Peak Point</span>
</div>
</div>
<div class="relative h-80 w-full">
<canvas id="stepChart"></canvas>
</div>
</div>
</div>
</div>
</div>
<!-- TAB 2: SIMULATION 1 (Fixed Zeta = 0.707) -->
<div id="view-sim1" class="hidden space-y-6">
<div class="bg-slate-900 border border-slate-800 rounded-2xl p-6 shadow-xl space-y-6">
<div>
<div class="flex items-center space-x-2">
<span class="px-2.5 py-1 bg-indigo-900/60 text-indigo-300 border border-indigo-700/60 text-xs rounded-lg font-semibold">Simulation 1</span>
<h2 class="text-lg font-bold text-slate-100">Fixed Damping Ratio ($\zeta = 0.707$), Varying Natural Frequency ($\omega_n$)</h2>
</div>
<p class="text-xs text-slate-400 mt-1">
Examines how natural frequency $\omega_n$ scales response speed without altering Percentage Overshoot ($\%OS \approx 4.32\%$).
</p>
</div>
<!-- Sim 1 Chart Container -->
<div class="relative h-96 w-full">
<canvas id="sim1Chart"></canvas>
</div>
<!-- Sim 1 Data Comparison Table -->
<div class="overflow-x-auto">
<table class="w-full text-left text-xs text-slate-300 border-collapse">
<thead>
<tr class="border-b border-slate-800 text-slate-400 bg-slate-950/60">
<th class="p-3">Curve / Frequency ($\omega_n$)</th>
<th class="p-3">Damping Ratio ($\zeta$)</th>
<th class="p-3">Peak Time ($t_p$)</th>
<th class="p-3">Percentage Overshoot ($\%OS$)</th>
<th class="p-3">Rise Time ($t_r$)</th>
<th class="p-3">Settling Time ($t_s$)</th>
</tr>
</thead>
<tbody id="table-sim1-body" class="divide-y divide-slate-800/60 code-font">
<!-- Populated dynamically by JS -->
</tbody>
</table>
</div>
</div>
</div>
<!-- TAB 3: SIMULATION 2 (Fixed Omega_n = 2*pi*1.0) -->
<div id="view-sim2" class="hidden space-y-6">
<div class="bg-slate-900 border border-slate-800 rounded-2xl p-6 shadow-xl space-y-6">
<div>
<div class="flex items-center space-x-2">
<span class="px-2.5 py-1 bg-sky-900/60 text-sky-300 border border-sky-700/60 text-xs rounded-lg font-semibold">Simulation 2</span>
<h2 class="text-lg font-bold text-slate-100">Fixed Natural Frequency ($\omega_n = 2\pi \times 1.0\text{ rad/s}$), Varying Damping Ratio ($\zeta$)</h2>
</div>
<p class="text-xs text-slate-400 mt-1">
Demonstrates how increasing $\zeta$ suppresses overshoot ($\%OS$) and damping ringing at the cost of a slower initial rise time ($t_r$).
</p>
</div>
<!-- Sim 2 Chart Container -->
<div class="relative h-96 w-full">
<canvas id="sim2Chart"></canvas>
</div>
<!-- Sim 2 Data Comparison Table -->
<div class="overflow-x-auto">
<table class="w-full text-left text-xs text-slate-300 border-collapse">
<thead>
<tr class="border-b border-slate-800 text-slate-400 bg-slate-950/60">
<th class="p-3">Curve / Damping ($\zeta$)</th>
<th class="p-3">Natural Freq ($\omega_n$)</th>
<th class="p-3">Peak Time ($t_p$)</th>
<th class="p-3">Percentage Overshoot ($\%OS$)</th>
<th class="p-3">Rise Time ($t_r$)</th>
<th class="p-3">Settling Time ($t_s$)</th>
</tr>
</thead>
<tbody id="table-sim2-body" class="divide-y divide-slate-800/60 code-font">
<!-- Populated dynamically by JS -->
</tbody>
</table>
</div>
</div>
</div>
</main>
<script>
// Global Chart instances
let stepChart = null;
let sim1Chart = null;
let sim2Chart = null;
// Interactive State
let currentZeta = 0.707;
let currentWn = 6.283; // 2 * pi * 1.0
// Mathematical Step Response Evaluator for 2nd Order System
function calculate2ndOrderStep(zeta, wn, maxTime = 5.0, numPoints = 1000) {
const time = [];
const response = [];
const dt = maxTime / numPoints;
let tp = null, peakVal = 0, osPct = 0, tr = null, ts = null;
// Underdamped regime (0 < zeta < 1)
if (zeta > 0 && zeta < 1.0) {
const wd = wn * Math.sqrt(1 - zeta * zeta);
const theta = Math.atan2(Math.sqrt(1 - zeta * zeta), zeta);
// Mathematical Peak Time
tp = Math.PI / wd;
peakVal = 1.0 + Math.exp(- (zeta * Math.PI) / Math.sqrt(1 - zeta * zeta));
osPct = Math.exp(- (zeta * Math.PI) / Math.sqrt(1 - zeta * zeta)) * 100.0;
// Mathematical Rise Time (0 to 100%)
tr = (Math.PI - theta) / wd;
for (let i = 0; i <= numPoints; i++) {
const t = i * dt;
time.push(t);
const val = 1.0 - (Math.exp(-zeta * wn * t) / Math.sqrt(1 - zeta * zeta)) * Math.sin(wd * t + theta);
response.push(val);
}
}
// Critically Damped regime (zeta = 1.0)
else if (Math.abs(zeta - 1.0) < 1e-4) {
osPct = 0.0;
tp = null;
tr = 2.237 / wn; // Approximation for 0->100% or 10->90%
for (let i = 0; i <= numPoints; i++) {
const t = i * dt;
time.push(t);
const val = 1.0 - Math.exp(-wn * t) * (1.0 + wn * t);
response.push(val);
}
}
// Overdamped regime (zeta > 1.0)
else {
osPct = 0.0;
tp = null;
const s1 = -zeta * wn + wn * Math.sqrt(zeta * zeta - 1.0);
const s2 = -zeta * wn - wn * Math.sqrt(zeta * zeta - 1.0);
for (let i = 0; i <= numPoints; i++) {
const t = i * dt;
time.push(t);
const val = 1.0 + (s2 * Math.exp(s1 * t) - s1 * Math.exp(s2 * t)) / (s1 - s2);
response.push(val);
}
}
// Estimate Settling Time (2% criterion: stays within [0.98, 1.02])
for (let i = response.length - 1; i >= 0; i--) {
if (Math.abs(response[i] - 1.0) > 0.02) {
ts = time[Math.min(i + 1, time.length - 1)];
break;
}
}
if (ts === null) ts = 0;
return { time, response, tp, peakVal, osPct, tr, ts };
}
function drawSPlane(zeta, wn) {
const canvas = document.getElementById('sPlaneCanvas');
if (!canvas) return;
const ctx = canvas.getContext('2d');
const w = canvas.width;
const h = canvas.height;
ctx.clearRect(0, 0, w, h);
// Origin center
const cx = w * 0.75; // Left shifted since poles are in LHP
const cy = h / 2;
const scale = Math.min(w, h) / (2.5 * Math.max(wn, 10));
// Axes
ctx.strokeStyle = '#334155';
ctx.lineWidth = 1;
ctx.beginPath();
ctx.moveTo(0, cy); ctx.lineTo(w, cy); // Real axis (sigma)
ctx.moveTo(cx, 0); ctx.lineTo(cx, h); // Imaginary axis (j*omega)
ctx.stroke();
// Axis labels
ctx.fillStyle = '#64748b';
ctx.font = '10px JetBrains Mono';
ctx.fillText('Re (σ)', 10, cy - 5);
ctx.fillText('Im (jω)', cx + 5, 12);
// Compute Poles
let pole1_real = 0, pole1_imag = 0;
let pole2_real = 0, pole2_imag = 0;
if (zeta < 1.0) {
pole1_real = -zeta * wn;
pole1_imag = wn * Math.sqrt(1 - zeta * zeta);
pole2_real = -zeta * wn;
pole2_imag = -wn * Math.sqrt(1 - zeta * zeta);
document.getElementById('pole-coords').innerText =
`s = ${pole1_real.toFixed(2)} ± j${pole1_imag.toFixed(2)}`;
} else {
pole1_real = -zeta * wn + wn * Math.sqrt(zeta * zeta - 1);
pole1_imag = 0;
pole2_real = -zeta * wn - wn * Math.sqrt(zeta * zeta - 1);
pole2_imag = 0;
document.getElementById('pole-coords').innerText =
`s1 = ${pole1_real.toFixed(2)}, s2 = ${pole2_real.toFixed(2)}`;
}
// Draw radial natural frequency circle
ctx.strokeStyle = '#1e293b';
ctx.setLineDash([3, 3]);
ctx.beginPath();
ctx.arc(cx, cy, wn * scale, 0, 2 * Math.PI);
ctx.stroke();
ctx.setLineDash([]);
// Helper function to draw 'X' for pole
function drawPoleX(px, py, color) {
const size = 6;
ctx.strokeStyle = color;
ctx.lineWidth = 2.5;
ctx.beginPath();
ctx.moveTo(px - size, py - size); ctx.lineTo(px + size, py + size);
ctx.moveTo(px + size, py - size); ctx.lineTo(px - size, py + size);
ctx.stroke();
}
// Map to canvas coords
const p1x = cx + pole1_real * scale;
const p1y = cy - pole1_imag * scale;
const p2x = cx + pole2_real * scale;
const p2y = cy - pole2_imag * scale;
drawPoleX(p1x, p1y, '#818cf8');
drawPoleX(p2x, p2y, '#818cf8');
}
function updateInteractivePlot() {
const data = calculate2ndOrderStep(currentZeta, currentWn, 4.0, 800);
// Update UI Metric Cards
document.getElementById('metric-os').innerText = data.osPct.toFixed(2);
document.getElementById('metric-tp').innerText = data.tp ? data.tp.toFixed(3) : 'N/A';
document.getElementById('metric-tr').innerText = data.tr ? data.tr.toFixed(3) : 'N/A';
document.getElementById('metric-ts').innerText = data.ts ? data.ts.toFixed(3) : 'N/A';
drawSPlane(currentZeta, currentWn);
if (!stepChart) {
const ctx = document.getElementById('stepChart').getContext('2d');
stepChart = new Chart(ctx, {
type: 'line',
data: {
labels: data.time,
datasets: [
{
label: 'Step Response c(t)',
data: data.response,
borderColor: '#6366f1',
borderWidth: 2.5,
pointRadius: 0,
tension: 0.1
},
{
label: 'Final Value (1.0)',
data: new Array(data.time.length).fill(1.0),
borderColor: '#64748b',
borderWidth: 1,
borderDash: [4, 4],
pointRadius: 0
}
]
},
options: {
responsive: true,
maintainAspectRatio: false,
animation: false,
scales: {
x: {
type: 'linear',
title: { display: true, text: 'Time (seconds)', color: '#94a3b8' },
grid: { color: '#1e293b' },
ticks: { color: '#64748b' }
},
y: {
title: { display: true, text: 'Response Amplitude c(t)', color: '#94a3b8' },
grid: { color: '#1e293b' },
ticks: { color: '#64748b' },
min: 0,
max: 1.8
}
},
plugins: {
legend: { display: false }
}
}
});
} else {
stepChart.data.labels = data.time;
stepChart.data.datasets[0].data = data.response;
stepChart.data.datasets[1].data = new Array(data.time.length).fill(1.0);
stepChart.update();
}
}
function renderSim1() {
const zetaFixed = 0.707;
const wnList = [
{ wn: 2 * Math.PI * 0.5, label: '0.5 Hz (3.14 rad/s)', color: '#f59e0b' },
{ wn: 2 * Math.PI * 1.0, label: '1.0 Hz (6.28 rad/s)', color: '#38bdf8' },
{ wn: 2 * Math.PI * 2.0, label: '2.0 Hz (12.57 rad/s)', color: '#10b981' }
];
const datasets = [
{
label: 'Final Value (1.0)',
data: new Array(500).fill(1.0),
borderColor: '#475569',
borderDash: [4, 4],
borderWidth: 1,
pointRadius: 0
}
];
const tableBody = document.getElementById('table-sim1-body');
tableBody.innerHTML = '';
let labelsTime = [];
wnList.forEach(item => {
const res = calculate2ndOrderStep(zetaFixed, item.wn, 4.0, 500);
labelsTime = res.time;
datasets.push({
label: `ω_n = ${item.label}`,
data: res.response,
borderColor: item.color,
borderWidth: 2,
pointRadius: 0
});
tableBody.innerHTML += `
<tr class="hover:bg-slate-800/40 transition">
<td class="p-3 font-semibold text-slate-200" style="color:${item.color}">${item.label}</td>
<td class="p-3 text-slate-300">${zetaFixed}</td>
<td class="p-3 text-sky-400">${res.tp ? res.tp.toFixed(3) + 's' : 'N/A'}</td>
<td class="p-3 text-amber-400">${res.osPct.toFixed(2)}%</td>
<td class="p-3 text-emerald-400">${res.tr ? res.tr.toFixed(3) + 's' : 'N/A'}</td>
<td class="p-3 text-indigo-400">${res.ts ? res.ts.toFixed(3) + 's' : 'N/A'}</td>
</tr>
`;
});
if (!sim1Chart) {
const ctx = document.getElementById('sim1Chart').getContext('2d');
sim1Chart = new Chart(ctx, {
type: 'line',
data: { labels: labelsTime, datasets: datasets },
options: {
responsive: true, maintainAspectRatio: false,
scales: {
x: { type: 'linear', title: { display: true, text: 'Time [s]', color: '#94a3b8' }, grid: { color: '#1e293b' }, ticks: { color: '#64748b' } },
y: { title: { display: true, text: 'Response c(t)', color: '#94a3b8' }, grid: { color: '#1e293b' }, ticks: { color: '#64748b' }, min: 0, max: 1.6 }
},
plugins: { legend: { labels: { color: '#cbd5e1' } } }
}
});
}
}
function renderSim2() {
const wnFixed = 2 * Math.PI * 1.0;
const zetaList = [
{ zeta: 0.2, label: 'ζ = 0.20 (Underdamped)', color: '#f59e0b' },
{ zeta: 0.5, label: 'ζ = 0.50 (Underdamped)', color: '#38bdf8' },
{ zeta: 0.707, label: 'ζ = 0.707 (Optimal)', color: '#818cf8' },
{ zeta: 0.9, label: 'ζ = 0.90 (Slight Underdamped)', color: '#10b981' }
];
const datasets = [
{
label: 'Final Value (1.0)',
data: new Array(500).fill(1.0),
borderColor: '#475569',
borderDash: [4, 4],
borderWidth: 1,
pointRadius: 0
}
];
const tableBody = document.getElementById('table-sim2-body');
tableBody.innerHTML = '';
let labelsTime = [];
zetaList.forEach(item => {
const res = calculate2ndOrderStep(item.zeta, wnFixed, 4.0, 500);
labelsTime = res.time;
datasets.push({
label: item.label,
data: res.response,
borderColor: item.color,
borderWidth: 2,
pointRadius: 0
});
tableBody.innerHTML += `
<tr class="hover:bg-slate-800/40 transition">
<td class="p-3 font-semibold" style="color:${item.color}">${item.label}</td>
<td class="p-3 text-slate-300">2π rad/s (1.0 Hz)</td>
<td class="p-3 text-sky-400">${res.tp ? res.tp.toFixed(3) + 's' : 'N/A'}</td>
<td class="p-3 text-amber-400">${res.osPct.toFixed(2)}%</td>
<td class="p-3 text-emerald-400">${res.tr ? res.tr.toFixed(3) + 's' : 'N/A'}</td>
<td class="p-3 text-indigo-400">${res.ts ? res.ts.toFixed(3) + 's' : 'N/A'}</td>
</tr>
`;
});
if (!sim2Chart) {
const ctx = document.getElementById('sim2Chart').getContext('2d');
sim2Chart = new Chart(ctx, {
type: 'line',
data: { labels: labelsTime, datasets: datasets },
options: {
responsive: true, maintainAspectRatio: false,
scales: {
x: { type: 'linear', title: { display: true, text: 'Time [s]', color: '#94a3b8' }, grid: { color: '#1e293b' }, ticks: { color: '#64748b' } },
y: { title: { display: true, text: 'Response c(t)', color: '#94a3b8' }, grid: { color: '#1e293b' }, ticks: { color: '#64748b' }, min: 0, max: 1.8 }
},
plugins: { legend: { labels: { color: '#cbd5e1' } } }
}
});
}
}
// Event Listeners for Controls
document.getElementById('slider-zeta').addEventListener('input', (e) => {
currentZeta = parseFloat(e.target.value);
document.getElementById('val-zeta').innerText = currentZeta.toFixed(3);
updateInteractivePlot();
});
document.getElementById('slider-wn').addEventListener('input', (e) => {
currentWn = parseFloat(e.target.value);
document.getElementById('val-wn').innerText = `${currentWn.toFixed(2)} rad/s`;
updateInteractivePlot();
});
function setPreset(z, wn) {
currentZeta = z;
currentWn = wn;
document.getElementById('slider-zeta').value = z;
document.getElementById('slider-wn').value = wn;
document.getElementById('val-zeta').innerText = z.toFixed(3);
document.getElementById('val-wn').innerText = `${wn.toFixed(2)} rad/s`;
updateInteractivePlot();
}
function resetParams() {
setPreset(0.707, 6.283);
}
function switchTab(tab) {
const views = ['interactive', 'sim1', 'sim2'];
views.forEach(v => {
document.getElementById(`view-${v}`).classList.add('hidden');
const btn = document.getElementById(`tab-${v}`);
if (btn) {
btn.classList.remove('bg-indigo-600', 'text-white', 'shadow-md');
btn.classList.add('text-slate-400');
}
});
document.getElementById(`view-${tab}`).classList.remove('hidden');
const activeBtn = document.getElementById(`tab-${tab}`);
if (activeBtn) {
activeBtn.classList.add('bg-indigo-600', 'text-white', 'shadow-md');
activeBtn.classList.remove('text-slate-400');
}
if (tab === 'sim1') renderSim1();
if (tab === 'sim2') renderSim2();
}
// Window Load Initialization
window.onload = function() {
updateInteractivePlot();
};
</script>
</body>
</html>Simulation Results & Parameter Effects Summary
| Parameter Changed | Rise Time | Peak Time | %OS | Settling Time 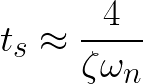 |
|---|---|---|---|---|
| Increasing omega_n (Fixed zeta = 0.707$) |
Decreases (Faster response) |
Decreases (Reaches peak sooner) |
Constant ( → 4.32%) (Unchanged) |
Decreases (Settles faster) |
| Increasing zeta (Fixed omega_n = 2*pi [rad/s]) |
Increases (Slower initial rise) |
Increases (Delayed peak) |
Decreases (Damps oscillations) |
Decreases (Suppresses ringing) |
Optimal Design Rule of Thumb:
Setting zeta 0.707 yields a fast rise time with minimal overshoot (%OS → 4.32%). To make a system faster without increasing overshoot, increase omega_n (e.g., by increasing actuator bandwidth) while maintaining zeta → 0.707.


